Reciprocal of differences calculation stymied by divide by zero exceptions
- Inicie sesión o regístrese para enviar comentarios
My task is to calculate the rate at which spam emails arrive by sorting the arrival times
and then taking the reciprocals of the successive differences.
Here is some candidate coding:
sed 's|^|1/|' <(awk 'p{print $2 -p}{p=$2}' data18-SU.txt | sed 's/\0/1/g' ) | bc -l
which is outright cheating, as sed changes all zeroes to ones regardless of position. I'd prefer
to change zeroes to ones only if they trail the number, which minimizes the error of the reciprocal
calculation. I want to preserve the existing order of the differences.
My aim is simply to plot the rate of arrival of the spam emails vs. their arrival times, for which
the highest rate would have the largest reciprocal of the difference of successive arrival times.
The main task for me to solve is to replace those zero differences with ones, even if that means
replacing all the trailing zeroes with ones.
| Adjunto | Tamaño |
|---|---|
| differences020421.txt | 690 bytes |
My aim is simply to plot the rate of arrival of the spam emails vs. their arrival times
Why not simply drawing an histogram?
So far I've had no luck with Grace's histogram application. I found a step-by-step set of instructions here:
https://stackoverflow.com/questions/23205999/how-to-use-xmgrace-to-plot-histogram-from-a-plot
but that would only make an histogram of the X-Spam-Score (sum; average ?) within each bin.
One might make one xmgrace plot by executingxmgrace data1.txt for this example. The window parameters are:
x-axis: 1.6075e+09 to 1.64075e+09
y-axis: -110 to +510
5597 rows in x, y arrangement; not sorted.
Another xmgrace plot can be made from the larger attached file after using sed to remove the placeholders QQ and qq.
My previously stated contrived command will take the reciprocals of the successive differences in the epochal times
without crashing on the frequent 0 differences, eliminated by changing _every_ 0 to a 1, and the reciprocals would
now be plotted on the y axis vs. the epochal times on the x axis, but my ad hoc code does not yet maintain any
relationship between the already-sorted epochal times and the reciprocals.
| Adjunto | Tamaño |
|---|---|
| data1.txt | 80.4 KB |
| data18-Rate.txt | 229.41 KB |
So far I've had no luck with Grace's histogram application.
I like gnuplot, but I usually preprocess the data with AWK. Here, I wrote:
#!/bin/sh

TMP=$(mktemp -t hist_by_week.sh.XXXXXX)

trap "rm $TMP 2>/dev/null" 0

sort -k 1,1n "$1" | awk -v begin=1564358400 -v interval=604800 '

{

    if ($1 < begin + interval)

        ++count

    else {

        begin += interval

        print count

        count = 0 } }

END {

    print count }' > $TMP

printf "set style data histogram

set boxwidth 2 relative

set style histogram

set style fill solid

set terminal pdf

set xlabel 'weeks'

set xrange [-1:$(wc -l < $TMP)]

set ylabel 'nb of spam emails'

set yrange [0:]

set output '$2'

plot '$TMP' using 1 notitle" | gnuplot
begin and interval should not be hard-coded (I chose Mon Jul 29 00:00:00 UTC 2019 and one week). Maybe you do not want to consider the data before begin (what can be achieved by conditioning the AWK action to '$1 >= begin'). If so, you probably want an end variable too.
The above script called with data1.txt and hist_by_week.pdf (in that order) in arguments writes the attached PDF.
| Adjunto | Tamaño |
|---|---|
| hist_by_week.pdf | 9.45 KB |
Looking for more fine structure in the data, I replotted data1.txt by days (86400 seconds). Magic Banana's
program is far easier to adjust than gnuplot's x & y ranges. Now it's much clearer that the spam rate was
already declining sharply before its hiatus in February 2021.
Back to my divide-by-zero problem
sed 's|^|1/|' <(awk 'p{print $2 -p}{p=$2}' data1.txt | if [ '$2-p' -eq :0 ]; then [ '$2-p' -eq :1 ]; fi) | bc -l
The if ... then statement attempts to test the output of the expression: awk 'p{print $2 -p}{p=$2}' data1.txt which runs OK but with occasional 0 outputs. The if ... then statement has proven troublesome; it fails with the complaint
bash: [: $2-p: integer expression expected.
| Adjunto | Tamaño |
|---|---|
| hist_by_day.pdf | 11.01 KB |
Looking for more fine structure in the data, I replotted data1.txt by days (86400 seconds).
The histogram I plotted was already rather irregular: you do not want to make it "finer". Nevertheless, you may want to observe that there is less spam during the weekends. To get the first attached histogram, I modified my previous script:
#!/bin/sh

TMP=$(mktemp -t hist_by_day_of_the_week.sh.XXXXXX)

trap "rm $TMP 2>/dev/null" 0

sort -k 1,1n "$1" | awk -v begin=1564358400 -v interval=86400 -v day=1 '

{

    while ($1 >= begin + interval) {

        begin += interval

	day = (day + 1) % 7 }

    ++count[day] }

END {

    for (d = 1; d != 7; ++d)

        print d, count[d]

    print 7, count[0] }' > $TMP

printf "set style data histogram

set boxwidth 2 relative

set style histogram

set style fill solid

set terminal pdf

set xlabel 'day of the week (1 is Monday)'

set xrange [-1:$(wc -l < $TMP)]

set ylabel 'nb of spam emails'

set yrange [0:]

set output '$2'

plot '$TMP' using 2:xtic(1) notitle" | gnuplot
Writing that modification, I realized, my previous script was wrong: it missed one email per week. Here it is again, fixed:
#!/bin/sh

TMP=$(mktemp -t hist_by_week.sh.XXXXXX)

trap "rm $TMP 2>/dev/null" 0

sort -k 1,1n "$1" | awk -v begin=1564358400 -v interval=604800 '

{

    while ($1 >= begin + interval) {

        begin += interval

        print count

        count = 0 }

    ++count }

END {

    print count }' > $TMP

printf "set style data histogram

set boxwidth 2 relative

set style histogram

set style fill solid

set terminal pdf

set xlabel 'weeks'

set xrange [-1:$(wc -l < $TMP)]

set ylabel 'nb of spam emails'

set yrange [0:]

set output '$2'

plot '$TMP' using 1 notitle" | gnuplot
The resulting histogram is attached.
Back to my divide-by-zero problem
What you will get after "solving" your problem, which should not be solved (the only reasonable result of 1/0 is infinite, not 1), will be very irregular and essentially unreadable, even understanding the unreasonable formula for the plotted values.
bash: [: $2-p: integer expression expected
That tells you '[' (aka 'test') is interpreting that. You ask it to tests whether the string "$2-p" is numerically equal to ":0". Neither side of the equality is a number, hence the error.
You apparently want that test inside the AWK program (because p is a variable in that program and $2 is the second field, not the second argument of the shell script, what bash would understand without the single quotes around '$2-p'): the AWK action would become 'if ($2 - p) print $2 - p; else print 1'. Anyway, I repeat: your are heading nowhere, in my opinion.
| Adjunto | Tamaño |
|---|---|
| hist_by_day_of_the_week.pdf | 9.64 KB |
| hist_by_week.pdf | 9.63 KB |
> there is less spam during the weekends.
Surely spamming has a cost, and spammers would not want to spoil resources on emails that have a lower probability to be opened.
It might be interesting to get a rough idea about which content gets sent preferably during the work week, and which content gets sent 7/7. Of course, that would probably require deeper text analyses of the email body, which might be out of bonds here.
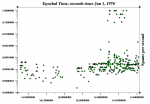
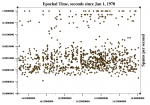
Admittedly, applying the reciprocal-of-the-arrival-time-difference calculation to the entire dataset
does produce so many data points as to be unreadable, but my plan all along has been to examine what
individual players have been up to. Attached are a couple of examples.
For the .RU-registrations graph, I applied mboxgrep to the entire database by searching on ".ru" and
deleting the irrelevant hits. To deal with the inevitable 0-difference events, I searched the difference
calculations and converted all the "0" results to placeholders: "PH". Before applying the reciprocal
calculations, I converted all those placeholders to 1's. Lastly, after pasting the various columns
back together, I searched the difference column for 1's and converted all the 1's associated with
placeholders to 10's. In the logarithmic Y axes, I chose the ranges to exclude those 10's; trying to
fit curves to the data is out of the question anyway, and none of the finite difference data has been
affected. The legitimate differences of 1 second aren't affected, because those are due to arrival
times that are truly different by one second.
The attached files, data20.txt and data21.txt are the data for the .RU-registrations and for api.whatsapp.com
respectively. Both have high and relatively consistent X-Spam-Scores.


| Adjunto | Tamaño |
|---|---|
| data20.txt | 19 KB |
| data21.txt | 53.7 KB |
- Inicie sesión o regístrese para enviar comentarios

