Lightbeam
Using interactive visualizations, Lightbeam enables you to see the first and third party sites you interact with on the Web. As you browse, Lightbeam reveals the full depth of the Web today, including parts that are not transparent to the average user. Using three distinct interactive graphic representations — Graph, Clock and List — Lightbeam enables you to examine individual third parties over time and space, identify where they connect to your online activity and provides ways for you to engage with this unique view of the Web.
How Lightbeam Works
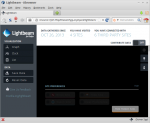
When you activate Lightbeam and visit a website, sometimes called the first party, the add-on creates a real time visualization of all the third parties that are active on that page. The default visualization is called the Graph view. As you then browse to a second site, the add-on highlights the third parties that are also active there and shows which third parties have seen you at both sites. The visualization grows with every site you visit and every request made from your browser. In addition to the Graph view, you can also see your data in a Clock view to examine connections over a 24-hour period or in a List view to drill down into individual sites.
How You Can Use Lightbeam to Help Us Illuminate the Inner Workings of the Web
As a part of Lightbeam, we're creating a big-picture view of how tracking works on the Internet, and how third-party sites are connected to multiple other sites. You may contribute your data to our crowdsourced directory by simply turning on the share switch within the add-on. To disable crowdsourcing, you can turn it off at any time. You can view your local data stored within Lightbeam at any time, or save your data by clicking the "Save" button under the data section on the left side of the add-on.
How is my information stored?
As a default, all info generated and used for Lightbeam’s visualizations and features are only stored locally on your computer. You can save a copy of your connection history at any time, which is also where you can see the specific data collected by the add-on. You may also reset Lightbeam to erase your locally stored connection history, disable it to stop data collection or uninstall it to instantly remove all locally stored data related to Lightbeam. Additional information related to Lightbeam’s file format is available here
The origins of Lightbeam
Lightbeam began in July 2011 as Collusion, a personal project by Mozilla software developer Atul Varma. Inspired by the book The Filter Bubble, Atul created an experimental add-on to visualize browsing behavior and data collection on the Web.
In February 2012, Gary Kovacs, Mozilla CEO at the time, introduced the Collusion add-on in a TED talk (now one of the most watched TED talks) about exposing online tracking.
In September 2012, Mozilla joined forces with students at Emily Carr University of Art + Design to develop and implement visualizations for the add-on. With the support of the Ford Foundation and the Natural Sciences and Engineering Research Council (NSERC), Collusion has been re-imagined as Lightbeam and was launched in the fall of 2013.
To read more about the collaboration, please visit http://www.simcentre.ca
Feedback
Your input is valuable to us, so don’t forget to rate, review or give us feedback after using Lightbeam. For more information, please check out our website at: www.mozilla.org/lightbeam
If you would like to keep an eye on our progress, file a bug, request a feature, or get a copy of the source code, please go to https://github.com/mozilla/lightbeam.
(This text was copied from the Mozilla addon page.)
- Install extension
- Auteurs: Mozilla
- Licence: MPL-2.0
- Téléchargement source code


