

Constant 96% CPU on 4 cores after T10 upgrade
- Inicie sesión ou rexístrese para enviar comentarios

I had 30°C CPU temperatures and 82% frequency usage with Etiona.
Now after upgrade to Nabia
I have 65°C CPU temperatures and nearly constant 95% frequency usage.
Before my Lenovo x250 cooling fan was mostly inaudible and could even stop, now it runs constantly.
I checked power management but there are no options for adjusting power-saving modes.
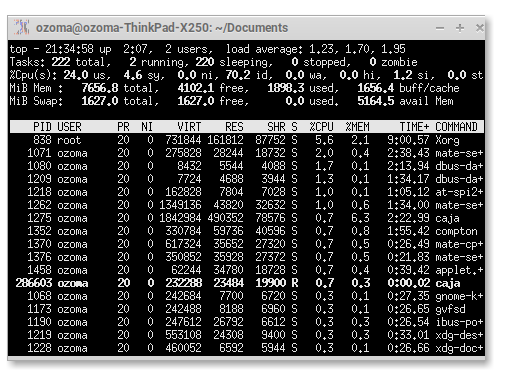
A typical screenshot of top shows trivial CPU usage spread across many processes in the lines below.
None of the forums seem to address this. What's wrong?
| Anexo | Tamaño |
|---|---|
| Screenshot at 2023-04-30 21-35-00.png | 23.18 KB |

We cannot see your screenshot, for some reason. What the processes taking most of the CPU? You want to consider all processes (not just yours).
Thank-you Magic Banana. I attach another screenshot done within a second after a first screenshot (not shown) was done, when approximately 20% more resource-using tasks appear.
On the one hand I suppose higher CPU loading will cause less thermal cycling of the hardware at a higher temperatures, thus possibly increasing its service life, however this is not what I want if editing text while commuting to and from work and running the laptop on battery power.
I did not add any new programs since the upgrade. Is there something that "top" is not showing me at any time?

There is something wrong with the attachments. Try removing the spaces in their names or just copy-paste the text. Otherwise, please tell us what is on the "%Cpu(s)" line (before the table) and what are the "COMMAND" at the top of the table and consuming what "%CPU".
Is there something that "top" is not showing me at any time?
By default it shows all the processes in descending order of "%CPU". That is what you want.
Thank you for all points mentioned. I'll start with a renamed attachment.

Caja (MATE's file manager) and Xorg eat up the resources, processor and main memory (2.5 GB together: that is definitely abnormal!). Run top again and type c to see the command line (or you can use a graphical system monitor or ps -ef | grep caja or...).
I did 90 samples of cpu usage with the following.
for (( i=10; i<100; i++ )); do cpu.sh 99 > cpu$i.txt; done
where in cpu.sh
I assigned end=$1
(( end+= 7)) # to get 99 results past the header
I called top -b -n1 | sed -n "7,$end p"
--------------------------------------
I obtained 90 files from cpu10.txt to cpu99.txt over a time span of approximately 15 seconds.
---------------------------------
from the following:
cat cpu??.txt | sort -r | grep caja | less -NSR
I found 20 recent high numbered PID's of caja typically lasting 0:00.10 running at 18-62% out of a total of 110 results where the remaining caja had the same PID and runtime was already at 40:50 and CPU usage for it was typically between 98 to 103% !
---------------------------------------
Since upgrading to Trisquel 10, I am no longer able to kill caja when too much memory was eaten up. Caja when it reappeared loaded the CPU and backed off. No longer now.
----------------------------------------------------
Furthermore as with Trisquel 9, I also coincidentally have 20 read-only mountings of archives on the same sda7 partition. I disbelieve that this is the cause.
-------------------------------------------------------
As a last resort I'll try to find and run a live USB session of Trisquel 10 to see what happens.
My uptime is presently 7 days 23 hours.
I still believe looking at the command line that called Caja may be informative. Maybe, it deals with your mount points, maybe with thumbnails, ...: the whole command line may tell. Besides the possibilities I listed in my previous post, you can post-process top -c (option -c shows the command lines):
$ top -c | grep caja
Additional info before Trisquel 10 upgrade:

Additional info after completing the upgrade to Trisquel 10.
Here is text describing applets on the bottom panel from various screenshots.
First 4 columns: CPU percentage performance Core 0 1 2 3
Next 5 columns: Temperatures: CPU, temp1, Package id 0, Core 0, Core 1.
97 96 96 96 - 60 50 57 57 56 60 2023-04-30_18h09-27 T10 Desktop with bash. Uptime 1 minute. Blue: Constant processor usage, Green: memory & cache, Red: Systen load average.
97 95 95 97 - 64 54 63 59 63 64 2023-04-30_19h28-54 window showing after 1 minute uptime
95 94 93 94 - 48 37 51 42 51 2023-05-06_18h10-24 window showing lowest observed temperatures
94 96 97 93 - 49 38 47 47 47 2023-05-07_13h38-47 window showing 1.5 minutes after resume from suspend: Blue: spike in absent and compensated processor usage.
96 95 96 95 - 61 52 65 55 65 2023-05-07_14h26-20 window after prolonged idle.
96 95 96 95 - 63 56 60 60 59 2023-04-08_12h31-59 window showing Blue: Blue shadow above processor use, Red: System load average with 10 horizontal bars!
96 94 96 92 - 62 52 66 56 66 2023-05-08_14h20-24 window showing typical blue green and red graphics: CPU 0-3 % performance; CPU, temp1, Package id 0, Core 0, Core 1.
96 91 97 96 - 63 54 65 56 65 2023-05-08_14h24-20 window showing impact of launch of abrowser
92 96 96 95 - 63 54 64 64 60 2023-05-08_14h32-35 window showing impact of exiting abrowser
95 92 92 95 - 46 34 46 46 43 2023-05-11_09h22-51 window showing 15 seconds after cold start.
95 95 96 96 - 55 46 55 49 55 2023-05-11_09h43-52 window showing typical idle time
96 95 95 94 - 55 46 58 58 51 2023-05-11_09h47-49 window showing typical with load average

Additional info after completing the upgrade to Trisquel 10.
Don't you want to further upgrade to Trisquel 11? It would be better to diagnose the problem once you are on the system you actually want to use.
I'm impressed with the rapid response I'm getting from the Trisquel forum, although it may be a few days before I report back again.
Before I upgrade to Trisquel 11, I would like to know what will be the performance hit on this Lenovo X-250 system that has a smaller solid state drive and 8Gb RAM. There is less room for me to experiment with concurrent versions.
Filesystem 1M-blocks Used Available Use% Mounted on
/dev/sda5 18601 12064 5568 69% /
/dev/sda7 49275 24577 24699 50% /home
tmpfs 3829 0 3829 0% /dev/shm
Thank-you very much (Magic Banana) for the support.
My CPU frequency is back to 82% and core temperatures are closer to 30 degrees. Simply killing the correct variant of the process did the trick!
Previous caja dumps without the -c option failed to reveal the instance of caja causing all the trouble.
My time invested in solving this and other issues should never become so dear to forget to express thanks in words to the FSF also!
Regards. :)
- Inicie sesión ou rexístrese para enviar comentarios